 We populated each institution’s Attainment, Developmental Education, Equity, and Transfer scorecards using data from Appendix B of Minnesota State’s Degree and Certificate Completion Report to the State Legislature. We drew from both the National College Attainment Network’s report, The Growing Gap: 2020 Edition, and from Minnesota State’s Degree and Certification Completion Report to the State Legislature for data included in each institution’s Affordability scorecard. Finally, data highlighted in the Voting scorecards for each institution came from the National Study of Learning, Voting, and Engagement (NSLVE)’s 2018 election database.
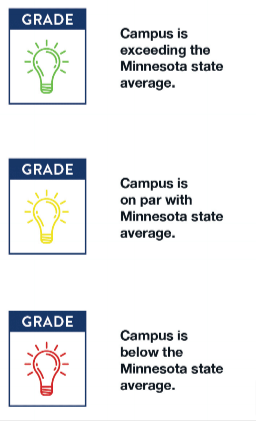
We approached grading for each Scorecard category as follows, giving institutions a grade of green, yellow, or red to designate exceeding, meeting, or underperforming expectations respectively:
Developmental Education
Institutions were graded based on the average of their developmental education course completion rates respective to the statewide developmental completion rate average. Institutions with average developmental education course completion rates above 60 percent were designated green. Institutions with an average developmental education course completion rate between 50 percent and 60 percent were designated yellow. Institutions with an average developmental education course completion rate below 50 percent were designated red.
Cost and Affordability
Institutions were graded respective to their affordability according to the National College Attainment Network’s affordability model. Institutions defined as “affordable” in NCAN’s model were designated green. Institutions defined as “unaffordable” by a value of less than $1,500 in NCAN’s model were designated yellow. Institutions defined as “unaffordable” by a value greater than or equal to $1,500 in NCAN’s model were designated red.
Equity
Institutions were graded based on the difference between their overall completion rate and their completion rate for students of color. Institutions where the difference in rates was zero or negative, indicating that students of color complete at the same rate as their peers, were designated green. Institutions where the difference in rates was below or equal to 7 percent were designated yellow. Institutions where the difference in rates was greater than 7 percent were designated red.
Voting
Institutions were graded based on their overall voting rate, with consideration given to their All-In Challenge designation. Institutions with an overall voting rate of 50 percent or higher were designated green. Institutions with an overall voting rate between 40 percent and 50 percent were designated yellow. Institutions with an overall voting rate below 40 percent were designated red. Two institutions did not have available data and did not receive a designation.